The latest UK higher education statistics once again show that the system never stops shifting. Around three million students enrolled in 2023/24, which proves that higher education still has a place in the nation. Beneath the total, though, we see certain changes that are not always easy to interpret.
That's the reason the Higher Education Statistics Agency (HESA) releases UK student data each year. Their figures outline the demographics of the country's student body and how it keeps evolving. The 2023/24 dataset offers insight into the complications in higher education.
Key Takeaways
- The UK higher education rate remains strong, with 2.9 million students enrolled in 2023/24, though this marks the first slight decline after several years of growth.
- Women make up 57% of all students, maintaining a consistent lead in higher education participation since 2016/17.
- Students aged 30 and over now form a growing share of first-degree learners, rising from 11% to 15% in five years.
- International enrolment declined, with EU students dropping by 21% and non-EU students by 7% year-on-year.
- Business and management remains the most studied subject, enrolling nearly 596,000 students, while Master’s degrees saw a 22% increase in completions.
Total Enrollment in Higher Education: Statistics in the UK
The UK student population in 2023/24 stood strong but slightly smaller than before. The student numbers show subtle shifts that hint at a slowdown after several years of growth.

- The UK higher education rate is reaching 2.9 million students in 2023/24.
- The student characteristics analysis showed that 57% of higher education students are female.
- New students are typically aged 20 and under, but the age group's share has declined year-on-year (40% in 2022/23 vs 36% in 2023/24).
- More individuals aged 30 and over seek their first degree.
- The number of students with a diagnosed disability rose by 30,040 year-on-year.
- The share of White students continues to fall slightly from 2020/21; however, they remain the most prevalent ethnicity (70% in 2023/24).
This small drop is still significant. A 1% change in a population of nearly three million people means thousands fewer students walking into lecture halls. However, a small rise of roughly three thousand undergraduate students suggests that higher education remains a clear priority.
Demographics of Students Enrolled in Higher Education
The data from 2023/24 gives a clear picture of who makes up today's student population. Several factors contribute to the story of how access to higher education continues to widen across the UK.
Gender Distribution
The gender balance in higher education remains steady. It has become one of the most consistent trends in recent data.
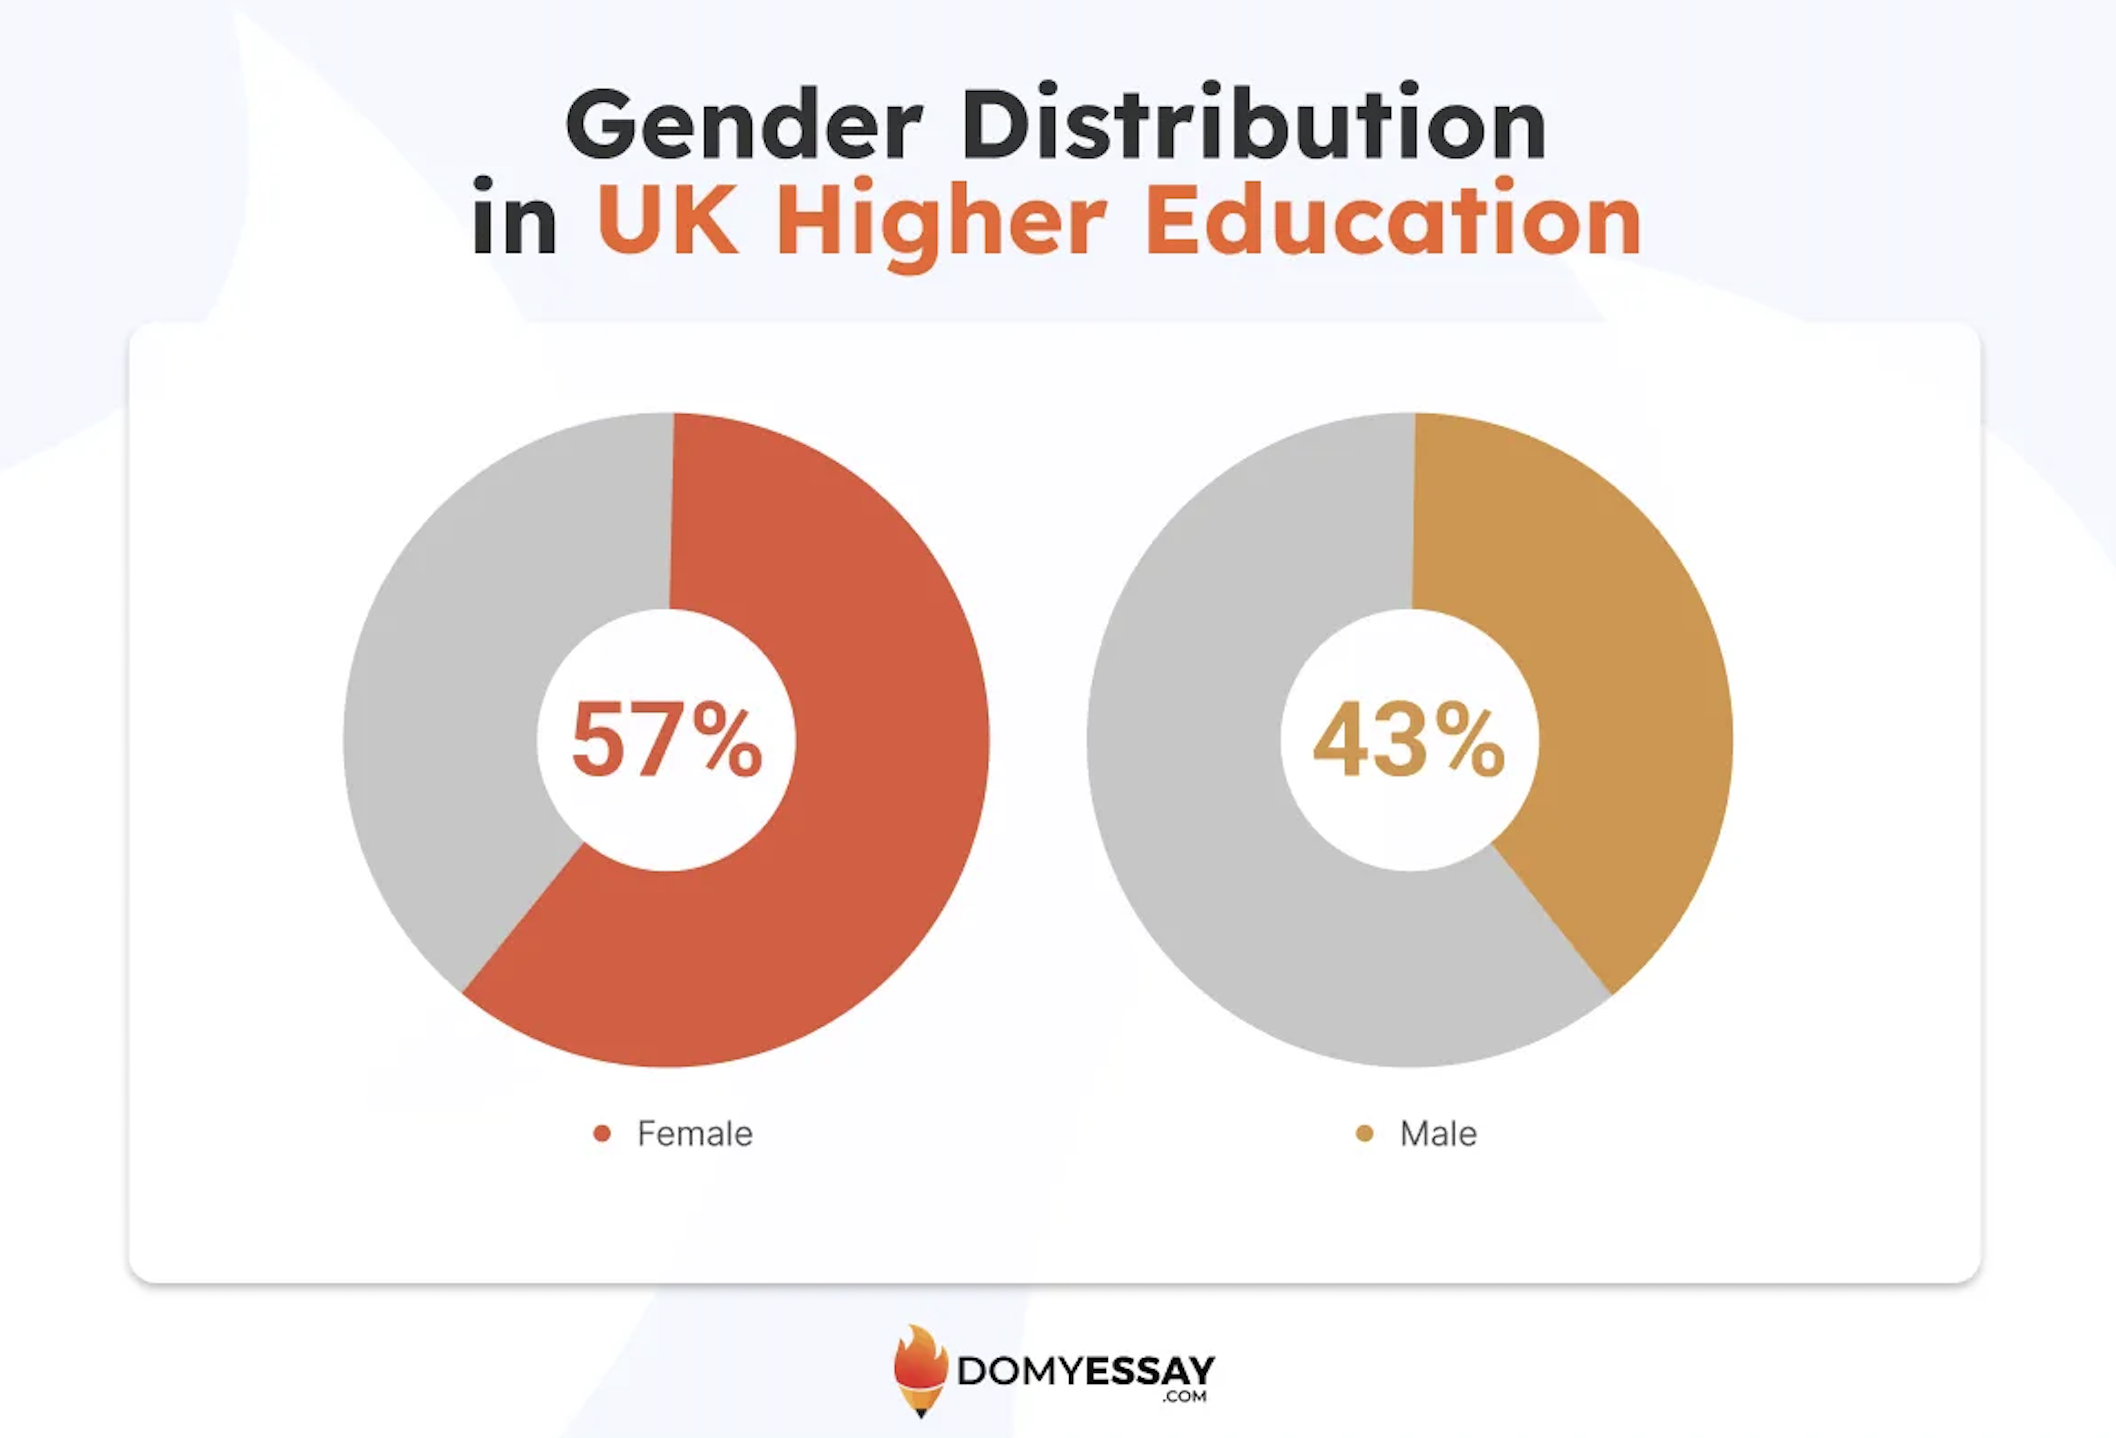
- 57% of all students were female.
- The share has stayed roughly the same since 2016/17.
- In postgraduate research, the gender gap reached 7%.
- In other undergraduate courses, it stretched to 22%.
Women now hold a place at every level of study. Their growing presence in postgraduate research signals a gradual shift in academic leadership. The smaller gap at advanced levels hints at progress in disciplines that were once male-dominated.
Age Profile
The number of students in the UK now spans a wider range of ages than before. The traditional model of entering university straight after school no longer applies to most learners.
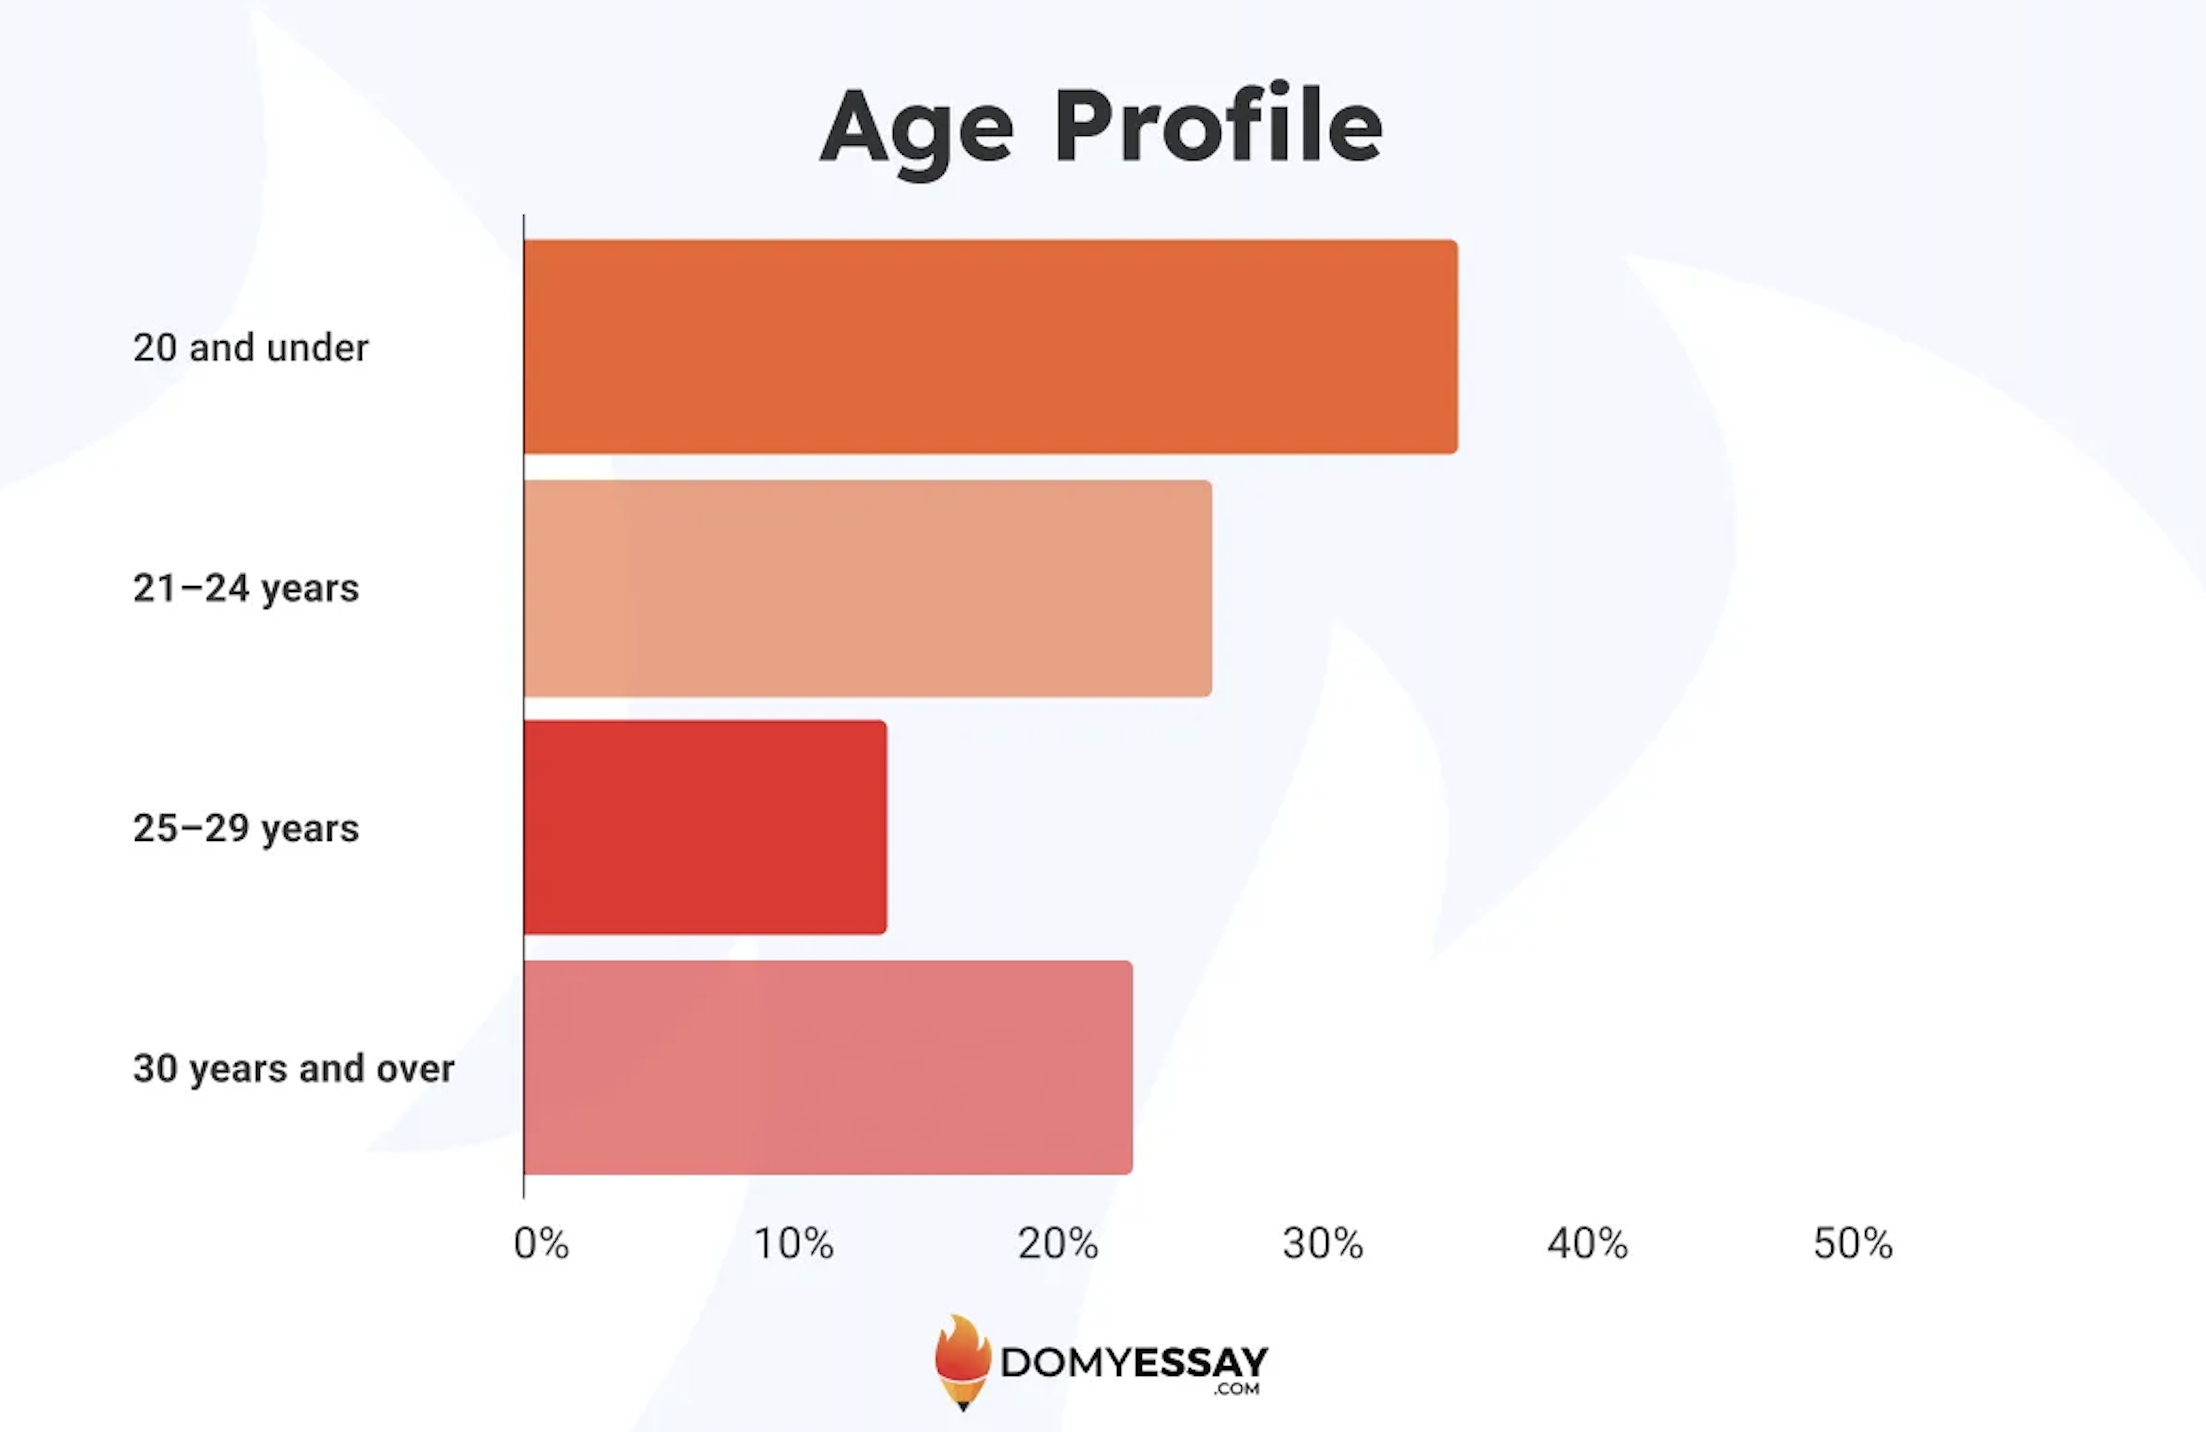
- Students aged 20 and under made up 36% of entrants, a drop from 40% in 2019.
- The 21–24 age group included 773,990 students.
- Those aged 30 and over studying for a first degree rose from 11% to 15% in five years.
Education is no longer something people leave behind in their early twenties. In fact, more and more mature students are often balancing studies with full-time jobs and even families. Flexibility, which was once a bonus, is now expected from modern higher education.
Disability Status
More students are now open about having a disability. With the growing awareness, the expectations also rise toward the systems designed to support those with disabilities.
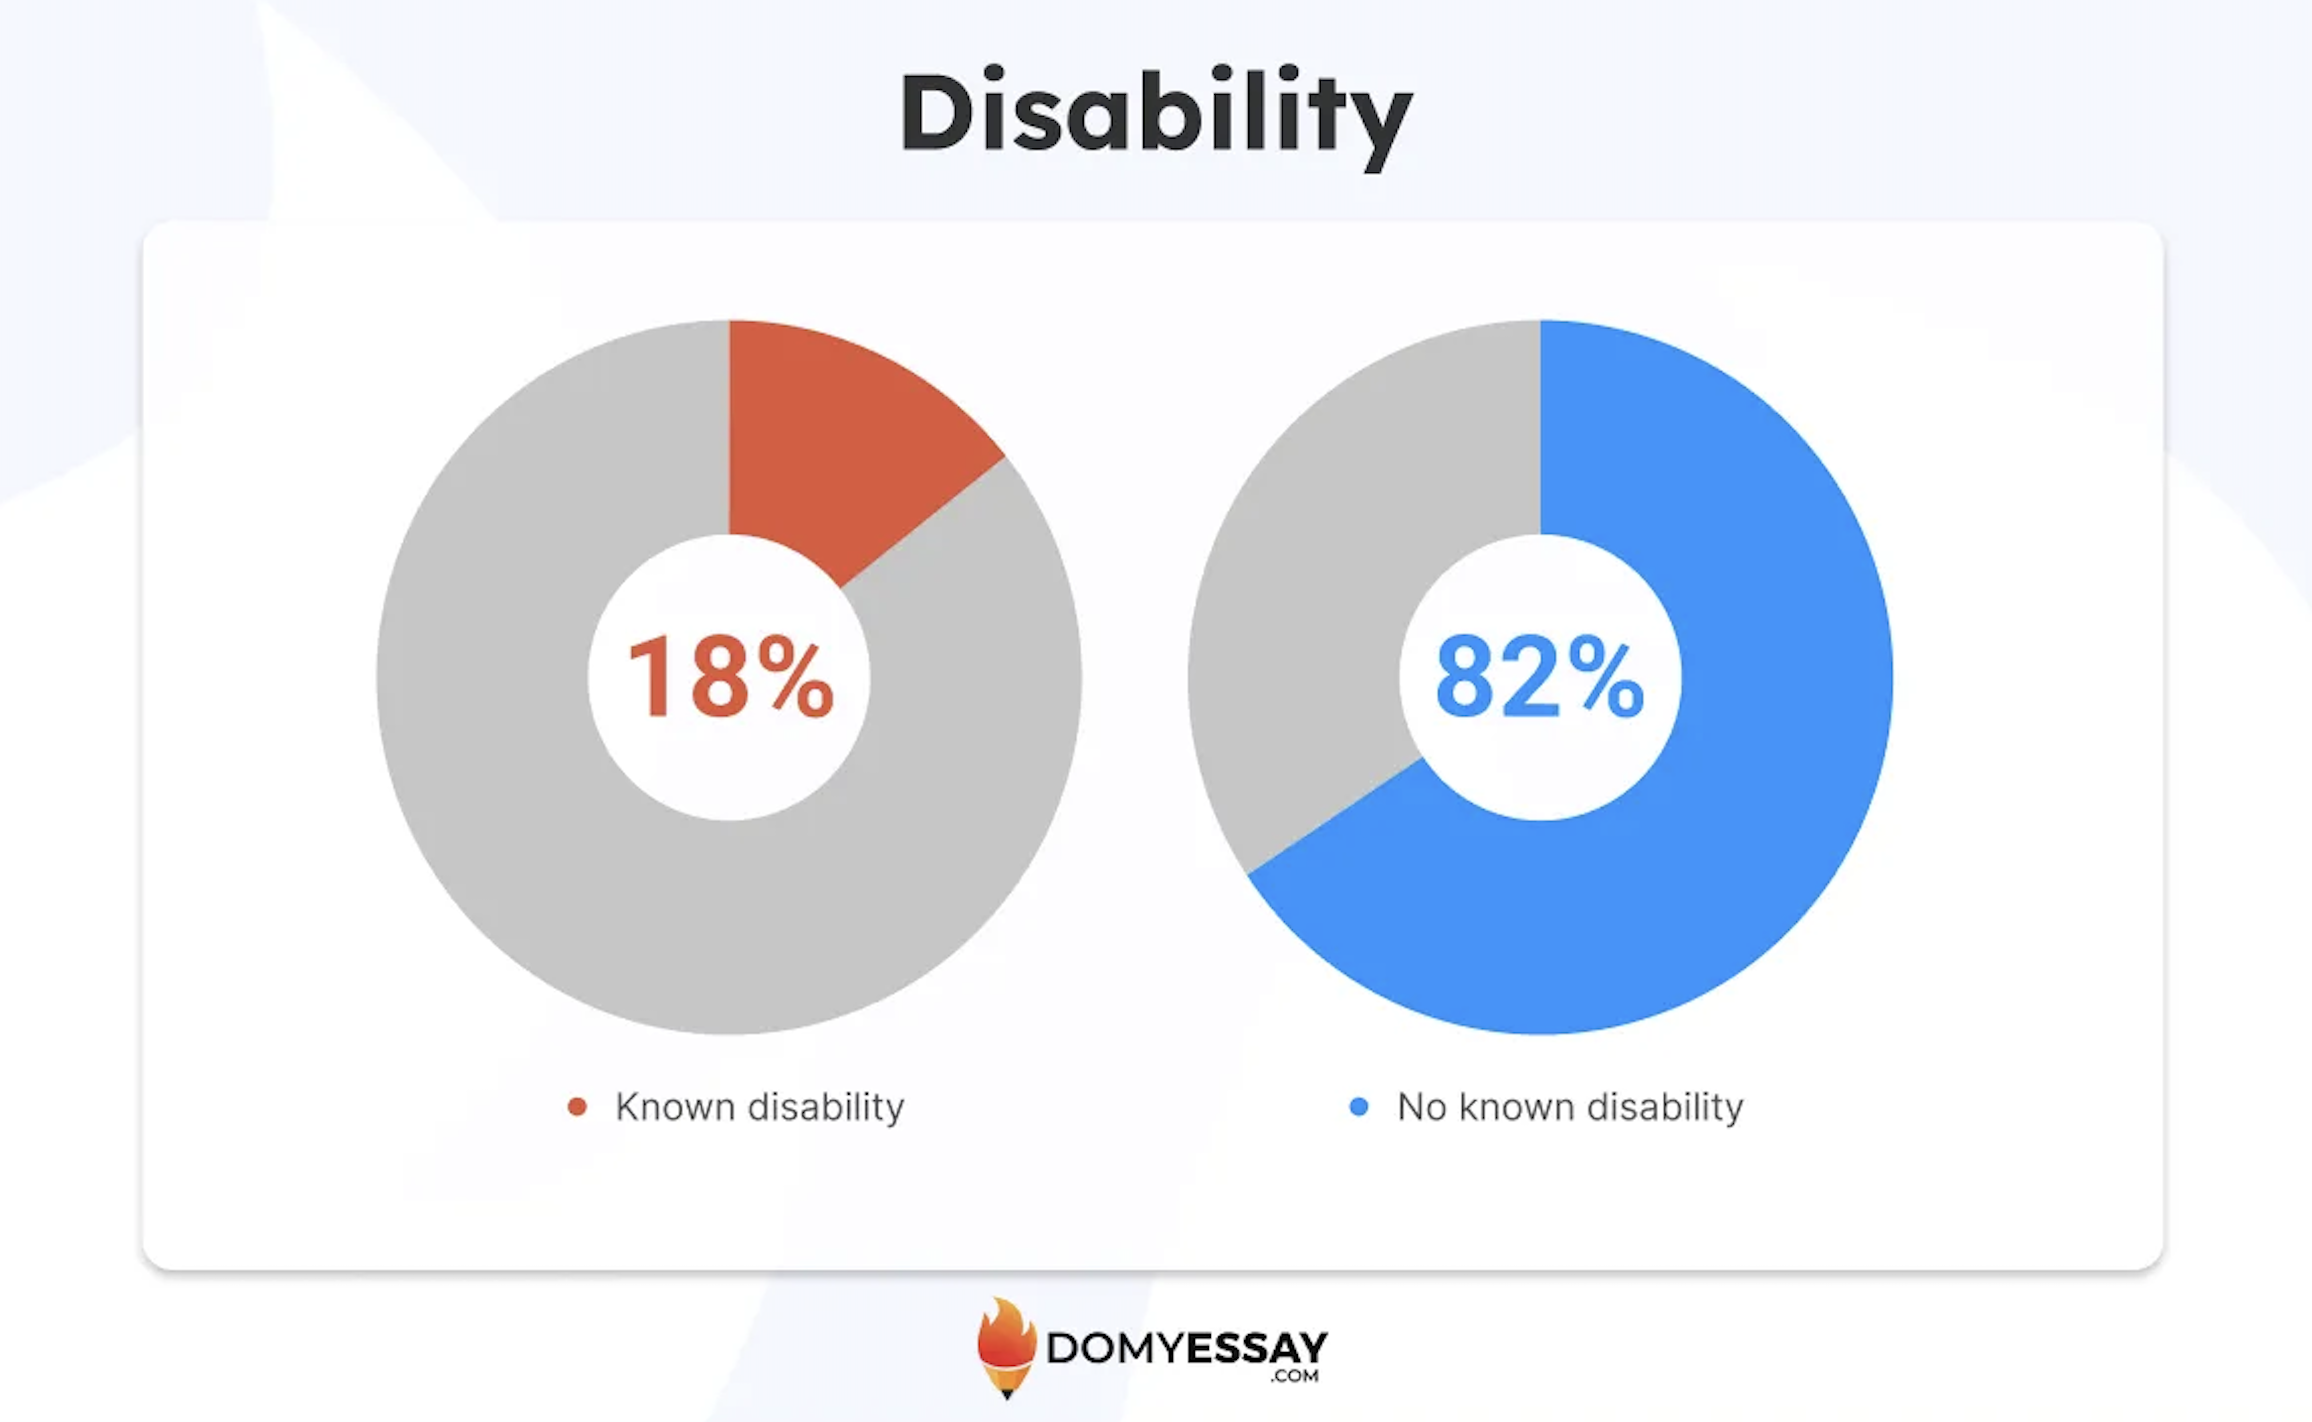
- The number of students with a known disability increased by 30,040 between 2022/23 and 2023/24.
- The share of students disclosing a disability has risen by 1% every year since 2019/20.
Universities appear to be creating spaces where students can speak about their needs without hesitation. This change suggests better access to mental health services, stronger communication about available support, and a gradual cultural shift toward openness. Each new disclosure represents trust, trust that the institution will respond and adapt.
Religious Belief
Religious identity among students is shifting gradually.

- 44% of students reported no religion, down from 49% in 2019/20.
- 14% identified as Muslim.
- 769,220 identified as Christian.
- 150,105 identified as Hindu.
The shift shows that faith on campus is becoming more varied. The steady rise in Muslim and Hindu representation points to demographic change, but also to cultural confidence among younger students of faith. Meanwhile, the slight drop in those with no religion suggests that belief itself is taking on more visible forms in student life.
Ethnic Groups
Ethnic diversity continues to define the makeup of UK universities.
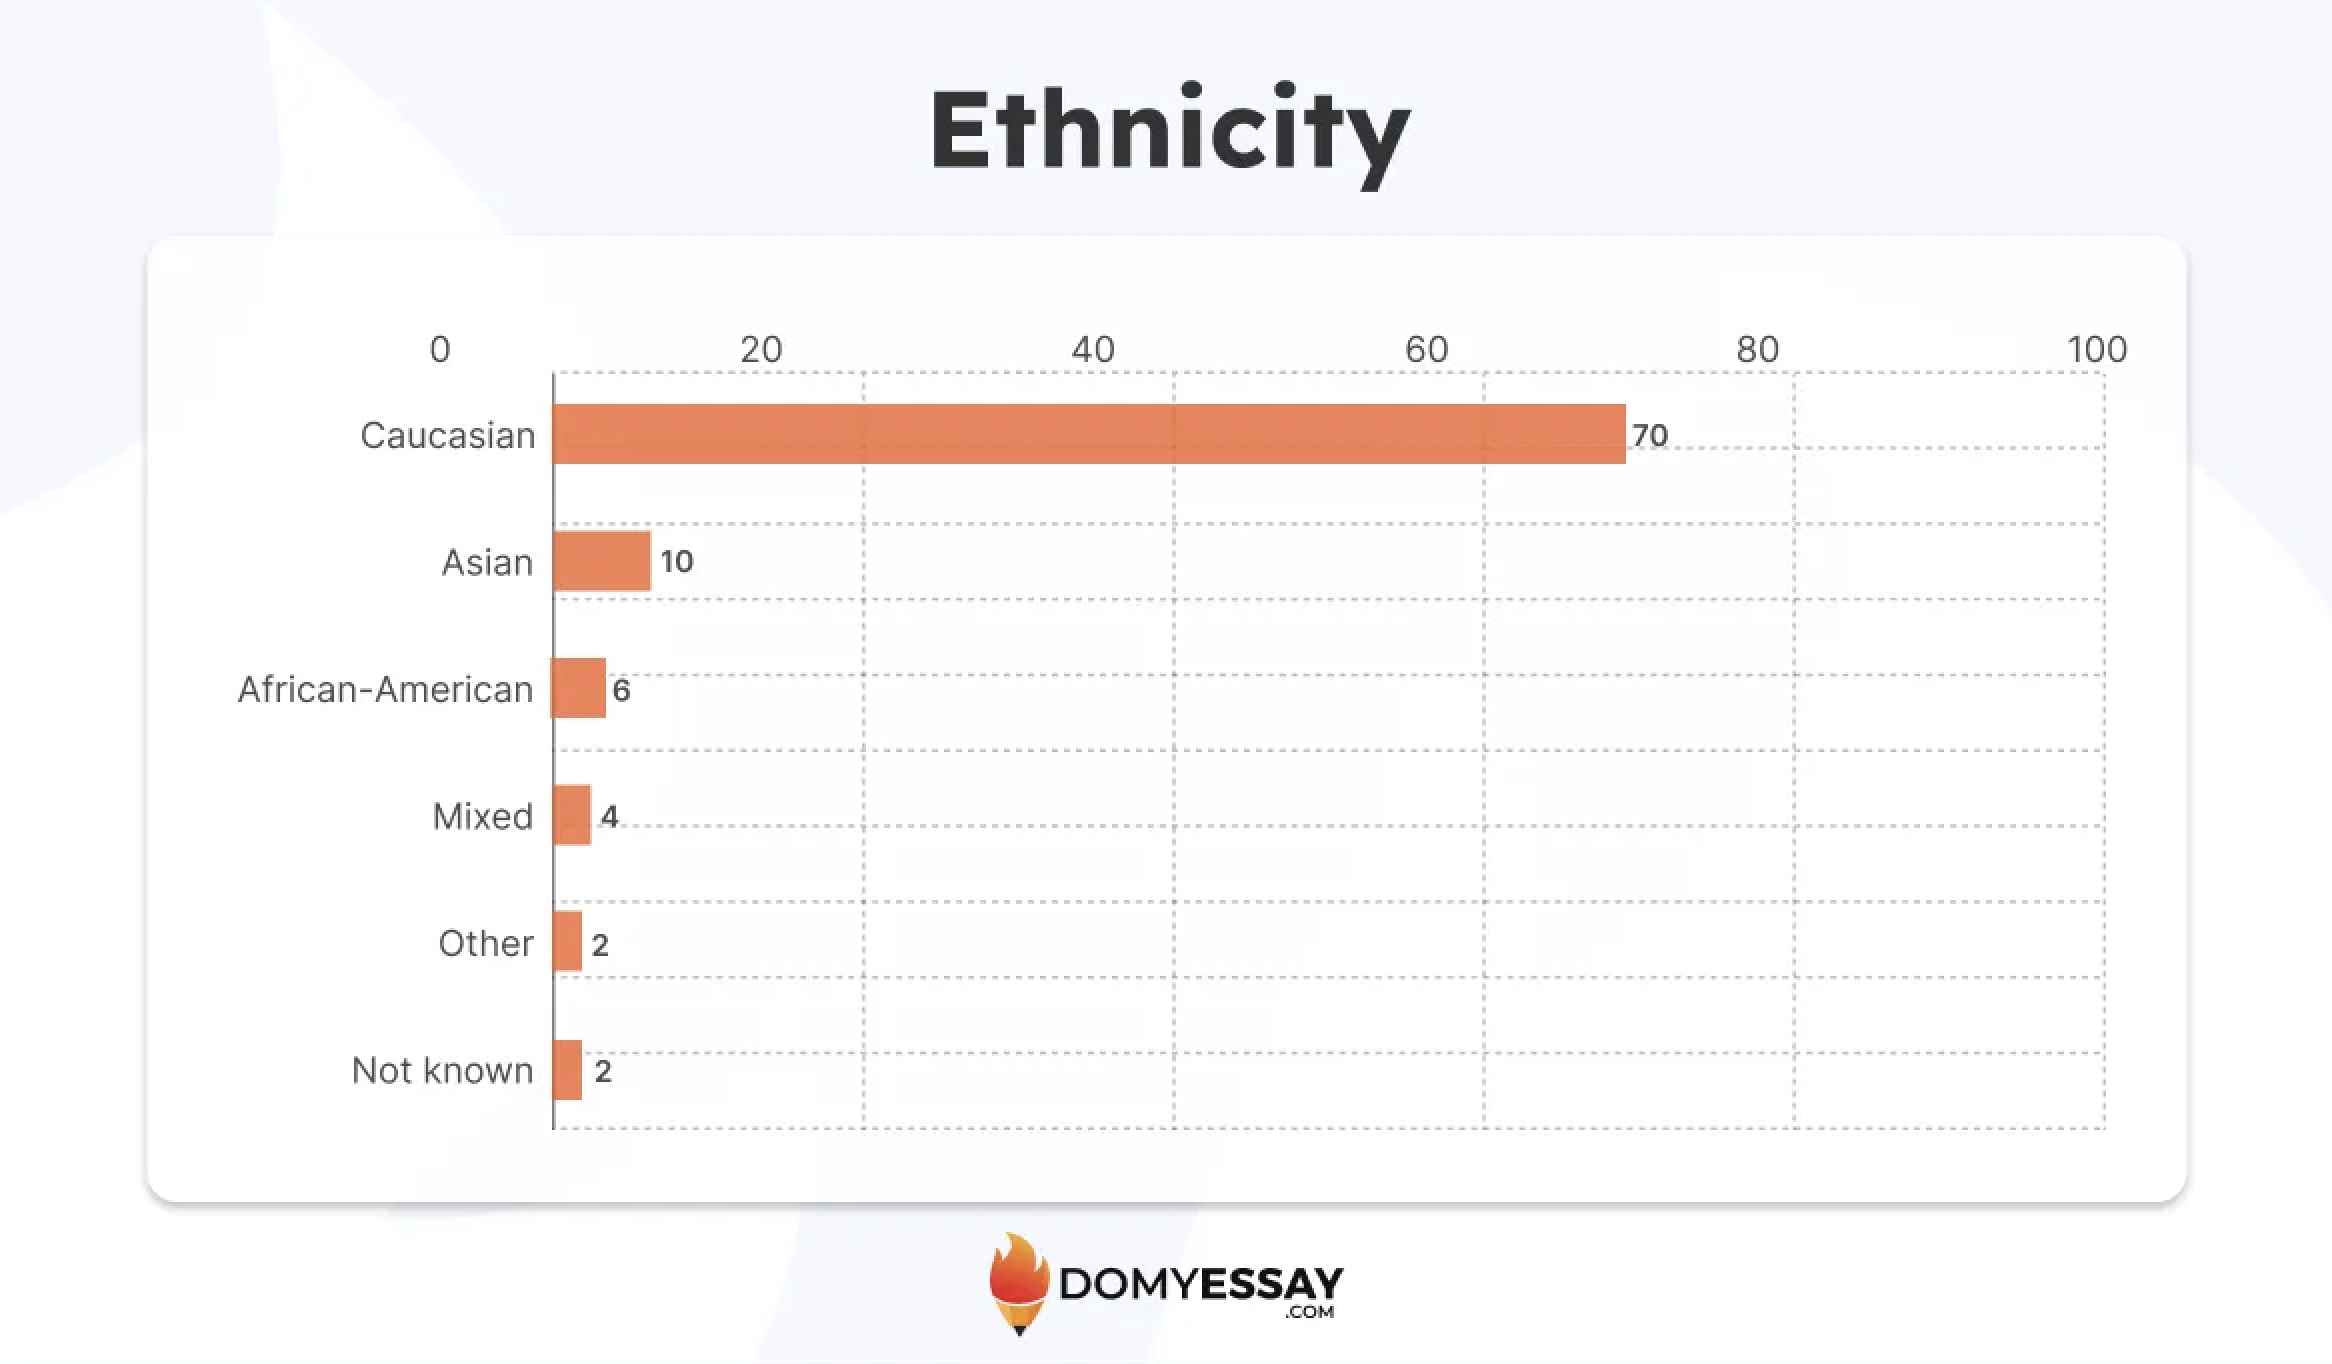
- Approximately 70% of students identified as White (UK domiciled) in 2023/24.
- 183,690 identified as African-American (an increase from 172,195 in 2022/23).
- 288,030 identified as Asian.
- 104,515 identified as Mixed ethnicity.
Increases in enrolments from diverse ethnic groups suggest progress in widening access to higher education. It's clear that universities draw more talent from once underrepresented communities. One could even argue that the very future of higher education in the UK will depend on this openness.
Socio-Economic Background
Access to higher education is becoming slightly more balanced, though the change is measured rather than dramatic.
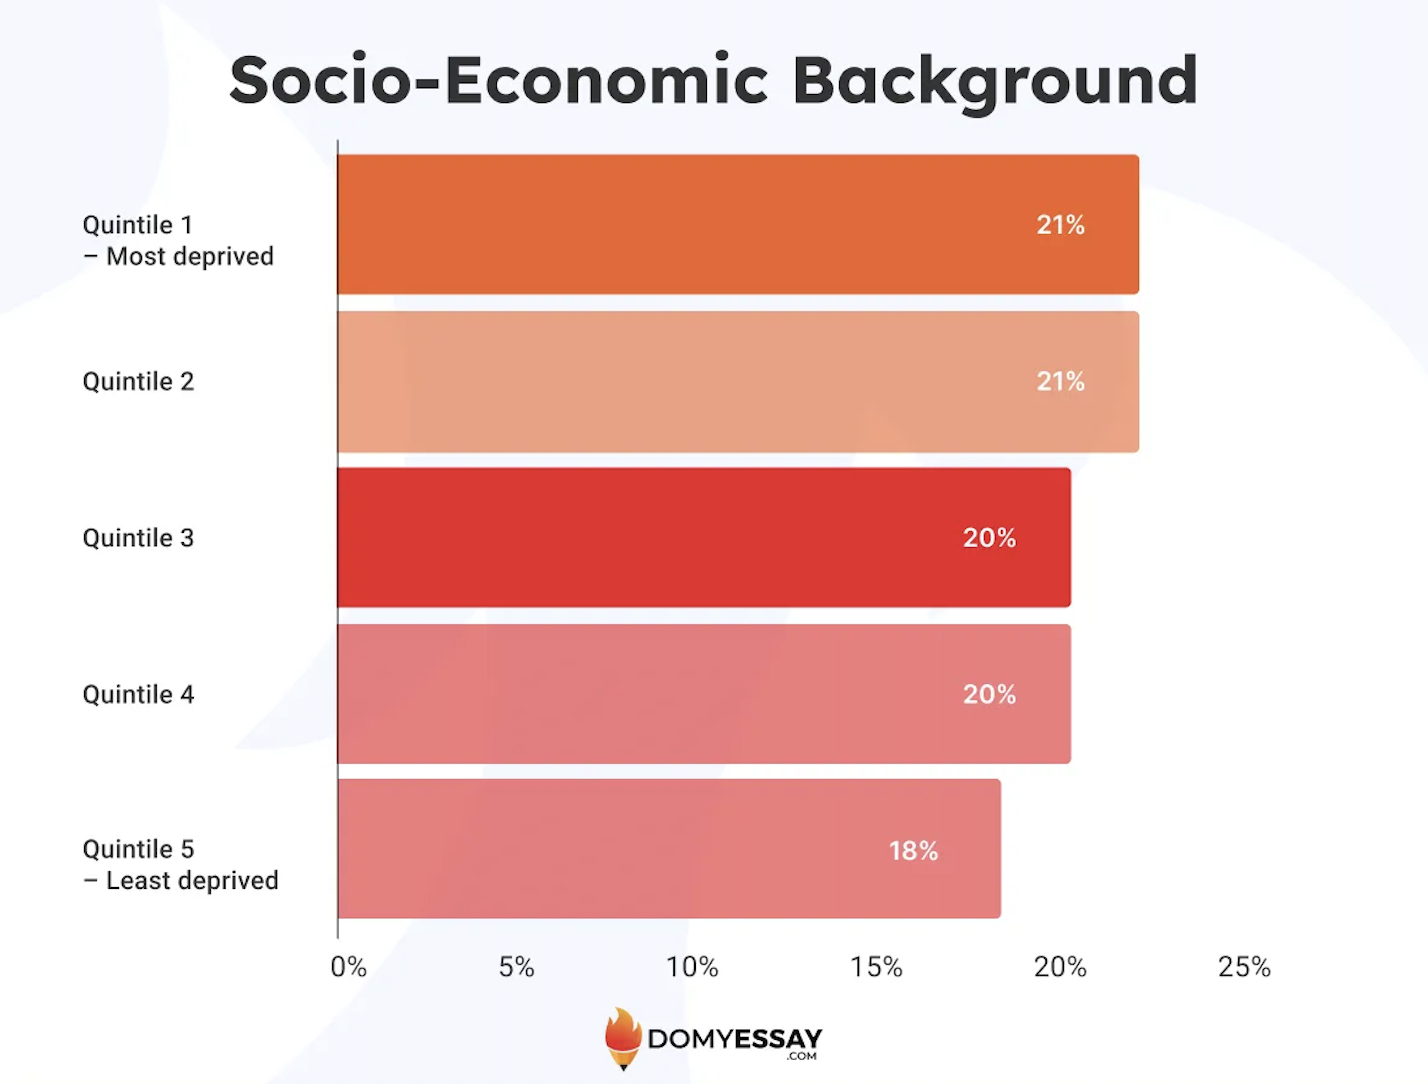
- Students from the most deprived areas rose from 254,835 to 269,425.
- Students from the least deprived areas stayed steady at about 267,565.
The rise in enrolments from lower-income areas shows a change in opportunity. Economic barriers are loosening, even if only by degrees. The balance is delicate, but still a promising sign that social background is becoming less of a gatekeeper to higher education.
Our graduate essay writing service can support students working on advanced academic projects.
What Does the International Student Body Look Like?
The total number of students whose permanent address is located outside the UK amounted to 732,285 in 2023/24. Only 75,490 among them are from the EU, while the overwhelming majority (656,795) came from non-EU countries. The total percentage of international students in UK universities fell compared to the previous year.
The EU share has been shrinking for several cycles now, but this time the fall was sharper, with about 21% in a single year. The top five EU countries of origin are: Ireland, France, Italy, Germany, Romania.
According to the UK international students statistics, the top five higher education providers among EU students are:
- University College London (3,375 students)
- The University of Edinburgh (2,575)
- King's College London (2,340)
- The University of Oxford (2,255)
- Imperial College of Science, Technology and Medicine (2,210)
Students from India were again the largest non-EU group in 2023/24. When combined with those from China, they made up about 48% of non-EU international students. The next largest groups came from Nigeria, Pakistan, and the United States.
The top five higher education providers among non-EU students are:
- University College London (26,885 students)
- BPP University (23,705)
- University of Hertfordshire (18,565)
- The University of Manchester (18,660)
- The University of Edinburgh (17,020)
The non-EU student population declined by approximately 7%, despite its large base. That was the first downturn since 2016/17. This decline is relatively easy to explain. The measures introduced to curb migration damage the UK's attractiveness, especially where post-study work is concerned.
As for the big picture, the international student body represents around a quarter of all enrolled students. However, 72% of postgraduate full-time students come from abroad. Undergraduate part-time studies, on the other hand, account only for 5% of the overall undergraduate part-time student body.
What Are the Most Sought-After Studies?
But what do students study while working toward their degrees? Here are the top 10 subjects among all students studying in the UK, along with the number of students per subject:
Interesting trends reveal themselves after breaking down the student population by subject and gender. Engineering and technology remain the most male-dominated fields, with 78% of the student body represented by men. The opposite is true in other fields, such as:
- Veterinary sciences
- Psychology
- Subjects allied to medicine
- Education and teaching
Female students account for roughly four-fifths of all students in the abovementioned areas.
What Figures Say About Qualifications
In 2023/24, students received 1,053,060 qualifications, an 8% increase from the previous year. Undergraduate awards made up 53% of all qualifications. Postgraduate degrees, meanwhile, rose by 4% compared to 2022/23. The surge in Master's degrees was especially striking: up 22% year on year! This showed how professional and academic upskilling are priorities for many students.
Which areas of study account for the most qualifications awarded in 2023/24? The figures are consistent with the most popular subjects, with the top 10 looking quite similar:
More and more students earn postgraduate qualifications. This shows that the labor market is now more oriented toward high-skilled jobs. The 2024 graduate labor market statistics published by the Department of Education help explain the rising demand for postgraduate degrees:
- Postgraduates are slightly more likely to be employed than graduates, with employment rates of 90.0% and 87.6%, respectively.
- They're also more likely to be employed in high-skilled roles (79.0% vs 67.9% for graduates).
- Both the median nominal (£47,000) and median real (£29,500) salaries for postgraduates are higher than for graduates (£42,000 and £26,500, respectively).
The Final Word
If there's one key insight we can glean from the HESA's data, it's that the 2023/24 report marks the first time total student enrollment numbers decline compared to the previous year. The number of student enrollments is expected to continue shrinking due to stricter student visa policies, costlier tuition, and the declining population of 18-year-olds.
In addition to that, higher education institutions should pay special attention to their allure on the international stage. While UK universities and colleges are routinely featured in the rankings of the world's top 100 institutions, the changes in student visa policies are working against them.
Those changes include the whopping 65% increase in health surcharges and higher overall financial requirements for student visas. The government also recently imposed restrictions on bringing dependents while pursuing undergraduate and postgraduate studies, all while making skilled worker visas hard to qualify for due to salary requirements.
FAQ
- Higher Education Statistics Agency. (2025, March 20). Higher education student statistics: UK, 2023/24 – Student numbers and characteristics (Statistical Bulletin SB271). https://www.hesa.ac.uk/news/20-03-2025/sb271-higher-education-student-statistics/numbers
- HESA. (2019). Data and analysis | HESA. https://www.hesa.ac.uk/ https://www.hesa.ac.uk/data-and-analysis
- Bolton, P. (2025, March 25). Higher Education Student Numbers. Parliament.uk; House of Commons Library. https://researchbriefings.files.parliament.uk/documents/CBP-7857/CBP-7857.pdf