A statistics project tests how well a student can pull a real dataset together, choose a test that fits the question right, and read and analyze results. Strong topics measure something countable, like study hours against exam scores, phone screen time against sleep, or product price against review ratings.
This guide sorts 200 statistics project ideas by subject and difficulty, so a topic that matches your course level takes a minute to find. Each statistics project topic on the list comes with two named variables and a test that works. The statistics project ideas for college students below run across beginner, intermediate, and advanced tiers under every subject.
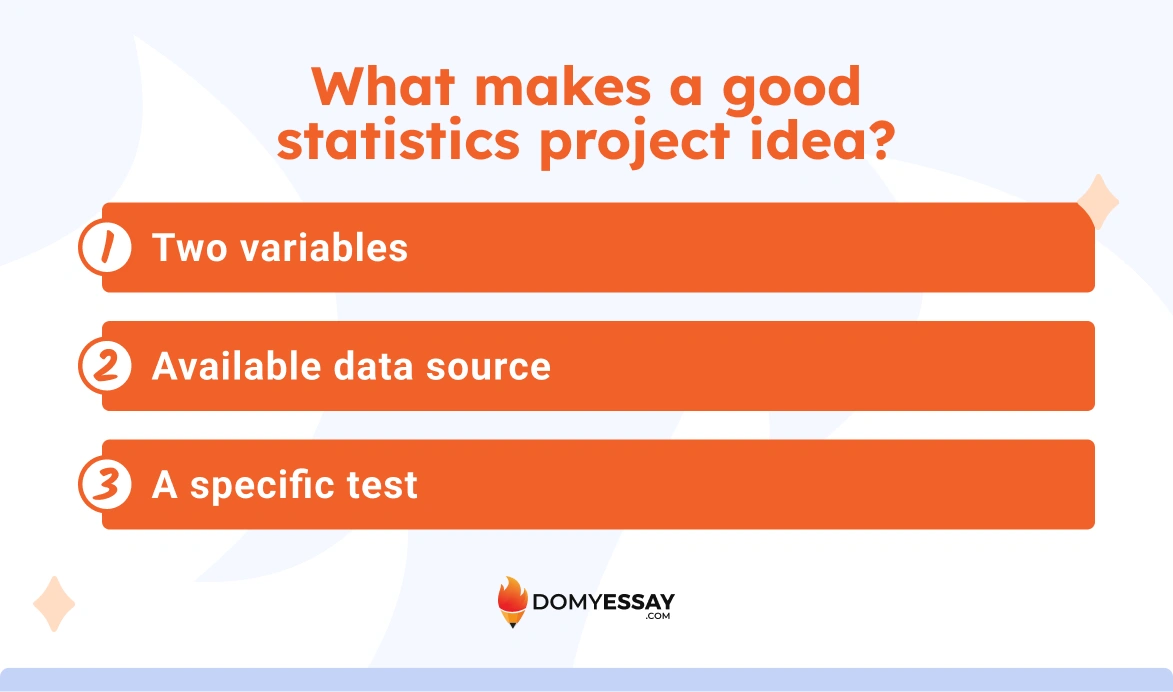
What makes a good statistics project idea?
A good statistics project idea passes three tests: two clear variables, a data source within reach, and a statistical method that fits them. Topics that name all three are ready to run. Topics that name none stall before data collection even starts.
- Two variables. A statistics project needs one thing you observe and one thing you measure in response, both as numbers. Study hours and test scores pass; “the history of probability” gives you nothing to measure.
- Available data source. The numbers have to come from somewhere you can access, like a survey of 40 classmates, a public dataset on Kaggle, or 30 days of your own step count. Questions that depend on hospital records fail, because students almost never get that access.
- A specific test. Each question should point to one method: a correlation, a chi-square test, a t-test, or a regression. “Do taller people run faster” points to a correlation between height and sprint time; “trends in social media” points to nothing.
Run a weak topic through all three. Coffee and productivity has a vague subject, no data source, and no method. Reworked, it becomes Among 35 college students, does daily coffee intake correlate with self-rated focus on a 1 to 10 scale? That version has two variables, a reachable sample, and one correlation test.
How do you turn a topic into a statistics research question?
To turn a topic into a statistics research question, narrow it in four steps: pick a broad subject, name two things that might relate, make each one measurable, then write a single question that states the population, the variables, and the setting. The output is one sentence you can test.
Most statistics project topics start too big to test. A four-step funnel ends in one measurable question.
- Step 1: Pick a broad subject. Any area where the data is within reach will do.
- Step 2: Two things that might relate. Something you observe, another one that changes in response.
- Step 3: Make variables measurable. Each needs a definition that produces a number you can collect.
- Step 4: The full question. One sentence that names the population, both variables, and the setting.
For example: Used cars → mileage and resale price → odometer miles and listing price in dollars → among 50 listings for one make and model, does odometer mileage correlate with the listing price in dollars?
Stuck on statistics project idea?
Allow our expert writers to handle this assignment for you.

Statistics project ideas by topic
These statistics project ideas are grouped by topic, so you can start in an area you already care about. Each one names two variables you can measure and a sample you can realistically collect. The statistics project ideas for college students below work for a semester project or a shorter assignment.
Education and student life
- GPA across students who study alone versus in groups: is there a gap?
- Compare class attendance between 9 a.m. and afternoon sections of the same course.
- How often do students visit office hours, and does it track with their final grade?
- Among commuter students, the link between travel time and missed classes.
- Do double majors report more weekly study hours than single majors?
- Handwritten notes versus laptop notes, measured against quiz recall a week later.
- Which predicts final grade better: midterm score or attendance rate?
- Participation in a study-abroad program and later interest in graduate school.
- Does a heavier course load relate to lower reported sleep?
- Library visits per week among freshmen compared to seniors.
- When during the term do students start their biggest assignment, and does it affect the grade?
- Caffeine intake on exam days and self-rated test anxiety.
- Are students who sit in the front row more likely to participate out loud?
- Number of tabs a student keeps open and how long one reading takes them.
- Does meal-plan type relate to how often students eat on campus?
Health and fitness
- Resting heart rate among students who cycle to class and those who drive.
- How many glasses of water a day does it take before energy ratings climb?
- Weekend sleep versus weekday sleep: how big is the difference across 40 students?
- Do people who log their meals eat more consistent portion sizes?
- Measure mood before and after a 20-minute walk, then compare the two.
- Caffeine intake per day and reported trouble falling asleep.
- Are morning exercisers more likely to stick with a routine than evening ones?
- Grip strength and weekly hours spent on strength training.
- Breakfast skippers versus breakfast eaters, compared on mid-morning focus.
- What share of students hit 8,000 daily steps, and does it change on rainy days?
- Does a pre-run stretch relate to how sore people feel the next morning?
- Screen time in the hour before bed and minutes taken to fall asleep.
- Among gym-goers, workout length compared to mood logged right after.
- Standing desk use and reported back discomfort over a week.
- How does hydration on game day line up with self-rated performance?
Sports
- Free-throw percentage and games won across one basketball season.
- Does playing at home actually raise a team’s odds of winning?
- Among intramural teams, warm-up length compared to first-half scoring.
- How does a runner’s weekly mileage line up with their 5K time?
- Toss result and final outcome over 30 cricket matches: any real connection?
- Players taller than six feet and the positions they end up in.
- Count the fouls called in loud games versus quiet ones, then compare.
- Is rest between matches linked to fewer injuries over a tournament?
- Possession percentage and goals scored across one soccer league.
- Which matters more for a team’s season record: offense or defense stats?
- Rookie draft order and total minutes played in a first season.
- Does a longer bench relate to stronger fourth-quarter scoring?
- Among marathon runners, pacing in the first half compared to finish time.
- Penalty count and crowd size across one season of home games.
- Are teams in newer stadiums drawing larger average attendance?
Economics and money
- Monthly income and the share of it that goes to eating out.
- Do students who use a budgeting app report less money stress at month’s end?
- Starting salary across 30 majors, matched against the cost of each degree.
- How far from downtown do you have to go before rent drops noticeably?
- Tip amounts on weekdays versus weekends at a campus café.
- Compare what shoppers will pay for a brand-name item and an identical generic.
- Are households with more members spending proportionally less per person on groceries?
- Allowance size and how much teenagers actually save.
- What day of the month do students run lowest on cash?
- Minimum wage and average studio rent across 20 cities.
- Does a longer checkout line relate to how much a shopper abandons their cart?
- Among campus jobs, hourly pay compared to reported satisfaction.
- Gift-card spending and how much over the card’s value people add.
- How does a product’s discount size relate to how many units sell?
- Coffee-shop prices and distance from the nearest university.
Technology and social media
- Notification count per hour and self-rated focus during study time.
- How many apps does a person check before finishing one homework problem?
- Does posting time change the number of likes a student account gets?
- Daily screen time among students who keep their phone in another room at night versus those who don’t.
- Count open browser tabs against reported stress while working.
- Are longer captions linked to higher follower counts, or lower?
- Reply speed among people who use read receipts and people who turn them off.
- Streaming subscriptions per household and total weekly viewing hours.
- Which app eats the most battery over a single day of normal use?
- Video length and the point where most viewers drop off.
- Does typing speed relate to how many texts a person sends in a day?
- Among students, phone age compared to how often they complain about battery.
- Hashtag count on a post and the reach it ends up getting.
- How does Wi-Fi speed on campus relate to reported frustration during class?
- Group-chat size and how fast a message gets a first reply.
Environment and climate
- Recycling rate and the number of bins a building provides.
- How much does midday temperature differ between a tree-lined street and a bare one?
- Do homes with solar panels actually report lower summer bills?
- Reusable-bottle owners and how many plastic bottles they still buy a week.
- Rainfall and daily bike-share ridership across one month.
- Among apartments, floor level compared to average energy use.
- Does living near a park relate to how often people exercise outside?
- Compost sign-up rates in buildings with curbside pickup versus those without.
- Count outdoor-activity minutes in long daylight months against short ones.
- What share of a neighborhood recycles, and does bin distance predict it?
- Thermostat setting and monthly energy use across 30 households.
- Are shorter showers linked to lower reported water bills?
- How does a building’s age relate to its average heating cost?
- Paper used per week in a dorm before and after a double-sided printing rule.
- Daily high temperature and how many people visit a campus green space.
Entertainment and media
- Movie runtime and average audience score across 40 films.
- Do sequels earn more than the originals that spawned them?
- How does a song’s tempo relate to how high it climbs on a weekly chart?
- Streaming services paid for and hours actually watched per week.
- Among films in a watch log, genre compared to completion rate.
- Are shorter podcast episodes more likely to be finished?
- Page count and average reader rating for 50 popular novels.
- Trailer views and opening-weekend ticket sales: how tightly do they move together?
- What release month gives a film its biggest opening?
- Game price and reported hours played per owner.
- Does a show’s episode count relate to how many viewers finish the season?
- Among top songs, average length compared to weeks spent on the chart.
- Review count and average score across 50 video games.
- How does a book’s cover style relate to its sales rank in one genre?
- Does a trailer’s length affect how many people watch it to the end?
Transport and cities
- Departure time and total morning commute length for one student over two weeks.
- How many cyclists pass per hour on streets with bike lanes versus without?
- Does a neighborhood’s walkability score predict how many cars households own?
- Bus frequency on a route and the average wait riders report.
- Parking price and lot occupancy across downtown.
- Count pedestrian near-misses at intersections with and without countdown signals.
- Among residents, distance to transit compared to reliance on a personal car.
- Is a wider road linked to faster traffic on residential streets?
- Weather conditions and same-day ride-share demand.
- Which slows a car trip more: traffic lights or stop signs on the route?
- Does a longer bike commute relate to how often someone switches to transit in winter?
- Among city blocks, streetlight count compared to reported nighttime safety.
- Rush-hour length and average speed on one highway stretch.
- How does a stop’s shelter affect how long riders are willing to wait?
- Sidewalk width and foot-traffic counts on a shopping street.
Food and consumer behaviour
- Menu position and how often a dish gets ordered at a dining hall.
- Do products labeled “limited edition” sell faster than the standard version?
- Price and average star rating across 40 items in one grocery category.
- How long do customers take to decide when a menu has 10 options versus 30?
- Among snacks in a taste test, packaging color compared to first pick.
- Are restaurants with more reviews rated higher or lower on average?
- Portion size served and how full diners say they feel afterward.
- Shelf height of a product and how often shoppers reach for it.
- What day sees the largest average food-delivery order?
- Offer free samples on some days and not others, then compare sales.
- Does a longer ingredient list relate to how healthy shoppers rate a snack?
- Among coffee orders, cup size compared to how much a customer tips.
- Calorie labels on a menu and what people end up choosing.
- How does a product’s placement near the register affect impulse buys?
- Spice level ordered and how often diners finish the dish.
Psychology and behaviour
- Background music tempo and how fast people walk through a store.
- Does the first option listed on a survey get picked more often?
- Reaction time compared against hours slept the night before.
- How much does a jar with money already in it raise later donations?
- Among groups deciding where to eat, group size and time to reach a choice.
- Are people told a task is “almost done” quicker to finish it?
- Menu length and how satisfied diners feel with what they picked.
- Room temperature and self-reported focus during a timed test.
- Which affects start time more: a tight deadline or a loose one?
- Handwriting speed and typing speed in the same 35 students.
- Does a crowded room change how long people are willing to wait in line?
- Among students, phone presence on the desk compared to quiz scores.
- Color of a room and the mood people report after 10 minutes in it.
- How does being watched affect how carefully people complete a task?
- Does a numbered to-do list relate to how many items actually get done?
Statistics project ideas by education level
Statistics project ideas should match the level of coursework behind them. High school projects lean on a single survey and one clear comparison, while college projects pull in larger samples, multiple variables, and tests that need software to run. The lists below split topics into the two levels so the scope fits the grading.
Statistics project ideas high school
- Shoe size and height across your classmates: is there a link?
- How many students bring lunch versus buy it, grade by grade?
- School-night TV hours and how tired students feel the next day.
- Which vending machine snack runs out first in a week?
- Do breakfast-eaters report fewer headaches during the school day?
- Weekly pocket money, and the share of it that gets saved.
- Pet ownership and how happy students rate themselves.
- Count the walkers versus the bus riders on rainy days and clear ones.
- Among 30 classmates, daily phone hours compared to texting speed.
- Does birth month tell you anything about height in one grade?
- Reaction time before a jog, reaction time after: how far apart?
- Which subject piles on the most homework over two weeks?
- Siblings at home and hours spent on chores.
- Are left-handed students faster at a short typing test?
- Hours of sleep and scores on the next morning’s quiz.
Statistics project ideas for college students
- Study hours per week against GPA, across 60 students.
- Part-time job or no part-time job: which group sleeps less?
- Internship count and how long the job hunt took after graduation.
- Does finals-week caffeine track with self-rated anxiety?
- Dating-app use and how satisfied students feel with their social life.
- Monthly spending among budgeters versus everyone else.
- Off-campus living and the number of clubs a student joins.
- Lecture attendance and final score in one big course: how tight is the link?
- Which predicts retention better, first-year GPA or first-year housing?
- Among 50 students, screen time compared to weekly reading hours.
- Longer commute, more missed morning classes?
- Volunteer hours and a student’s sense of belonging on campus.
- Declared major or undeclared: which group reports more stress?
- A course’s grading curve and the rating students give it.
- Roommates and reported sleep quality over one semester.
What are statistics project ideas by statistical method?
Statistics project ideas can also be sorted by the method you’ll run, which keeps the analysis from becoming an afterthought. These data analysis project ideas are grouped by the test each one leads to, so you pick a topic already matched to descriptive stats, a correlation, a t-test, a chi-square test, ANOVA, or regression.
Descriptive statistics projects
- Daily step count over a month, split by day of the week.
- How spread out are the quiz scores in one class?
- The price range of 50 used textbooks in a single subject.
- Most common commute method among students, with the percentages.
- Lunchtime wait at a campus café: what’s typical?
- Average sleep across a dorm floor, broken down by year.
- Which dining-hall station draws the longest line at noon?
- Spending per week among 40 students, from lowest to highest.
- How many hours a day does a typical student spend on their phone?
- The spread of heights on one intramural basketball team.
- Most-borrowed book genre at a campus library over a month.
- What share of a class owns a car versus relies on transit?
- Range of monthly rent across 30 nearby apartments.
- Caffeine servings per day among surveyed students: what’s the average?
- How often does a bus on one route actually arrive on time?
Correlation projects
- Sleep hours and next-morning alertness across 40 students.
- More screen time, more end-of-day eye strain?
- Hours studied against exam score in one course.
- Weekly mileage and resting heart rate among runners.
- Phone battery age and daily charge cycles: how closely do they move?
- Does water intake relate to afternoon energy ratings?
- Height and vertical jump on one volleyball roster.
- Time spent on social media and reported procrastination.
- Commute distance and monthly fuel spending among drivers.
- Does a product’s price track with its average review score?
- Class size and how often students ask questions.
- Hours of part-time work and weekly study hours.
- Room temperature and typing accuracy on a timed test.
- Does a song’s length relate to how often it gets replayed?
- Number of practice tests taken and final exam score.
Hypothesis testing projects
- Morning section versus afternoon section: do the average scores differ?
- Typed notes or handwritten notes, measured against quiz recall.
- Daily water intake among athletes compared to non-athletes.
- Does background music change average reading speed on a timed test?
- Weekday tips versus weekend tips at one café.
- Mean sleep among on-campus and off-campus students.
- Do first-years spend more on textbooks than seniors?
- Reaction time with the phone on the desk versus in a bag.
- Average grocery bill among meal-preppers compared to non-preppers.
- Does a standing desk change reported focus versus a seated one?
- Finishing time for runners who warm up and those who don’t.
- Mean quiz score before lunch versus after lunch.
- Do students in group projects rate the course higher than solo-work students?
- Steps per day on gym days compared to rest days.
- Does coffee before a test change the average completion time?
Chi-square projects
- Is coffee preference independent of working night shifts?
- Grade level and preferred study spot: related or not?
- Stairs or elevator, and whether that splits by gender in a dorm.
- Pet ownership among apartment renters versus house renters.
- Snack choice and the time of day it’s bought.
- Does major relate to whether a student owns a car?
- Preferred news source and age group among those surveyed.
- Class year and choice of coffee, tea, or energy drink.
- Is handedness independent of which sport a student plays?
- Does living situation relate to how students commute?
- Favorite genre and whether someone reads physical books or e-books.
- Breakfast habit and whether a student skips morning classes.
- Does phone brand relate to preferred messaging app?
- Seating choice in a lecture hall and whether a student participates.
- Is weekend plan type independent of whether a student has a part-time job?
ANOVA projects
- Focus scores across three room temperatures.
- Do study-hour averages differ among freshmen, sophomores, and juniors?
- Plant growth under three light conditions over four weeks.
- Reaction time in groups that slept 5, 7, and 9 hours.
- Average tip across three sections of a restaurant floor.
- Test scores under silence, background music, and café noise.
- Do average grades differ across three class start times?
- Dough rise across three yeast amounts over the same window.
- Sales across three shelf heights for the same product.
- Mean satisfaction among users of three different note apps.
- Does watering frequency change average plant height across three groups?
- Typing speed on three different keyboard types.
- Energy ratings after breakfast, no breakfast, and a late breakfast.
- Average wait time at three checkout lanes over one week.
- Do quiz scores differ across three study methods?
Regression projects
- Final grade predicted from study hours and attendance together.
- How well do size and location predict apartment rent?
- 5K finish time modeled from weekly mileage and resting heart rate.
- Phone battery health from age and daily charge count.
- Monthly food spending predicted by household size and income.
- Does screen time plus sleep predict next-day focus?
- Used-car price from mileage and model year.
- Predict final exam score from midterm and homework average.
- Coffee sales from daily temperature and day of the week.
- Tip amount modeled from bill size and party count.
- Predict a plant’s height from water and sunlight hours.
- Monthly utility bill from apartment size and number of residents.
- Does study-hour count plus prior GPA predict course grade?
- Website time-on-page from word count and image count.
- Predict a runner’s race time from training days per week and age.
Which statistics project ideas should you avoid?
Some statistics project ideas fall apart the first time you sit down to collect data or pick a test. The six below fail for reasons you can catch early, before a week disappears into a topic that was never going to work.
- No variables to measure. “The history of the normal distribution” reads fine as an essay, but there’s nothing in it to count. No pair of variables, no project.
- Data you can’t reach. A great-sounding question about global ocean salinity stalls once you realize the data sits behind an agency you’ll never access. The numbers have to come from a survey, a public file, or your own log.
- Including people you shouldn’t study. Minors, patients, anyone with a trauma history, these need ethics review no semester project can clear.
- A sample too thin for the math. A chi-square on eight responses means nothing. Pick the test first, then collect enough to support it.
- Questions the data already answers. If the dataset’s summary states the average outright, there’s no analysis left to do.
- Anything behind a paywall. Premium reports cost money a student project doesn’t have. Stick to open sources.
Is there little time left until the submission?
Streamline the writing process with our professional writing service!

Final thoughts
A workable statistics project needs three things: two measurable variables, a data source you can reach, and a test that fits. Pick a subject you care about, narrow it to one testable sentence, match the scope to your level, and skip the dead ends that sink projects before analysis starts.
FAQ