If two quantities tend to increase/decrease simultaneously, this is a correlation. If one leads to the other increasing/decreasing, there is causation. Understanding correlation vs causation can be important when investigating the possible causes of an observed correlation. Considering this, ice cream and drownings are correlated due to rising summer temperatures. To prove causation, ideally an RCT is conducted; failing which, a number of independent observations need to exclude possible alternate causalities - confounders, reverse causation, or coincidence.
Coincidences can readily be identified. For example, on Tyler Vigen's website "The Art of Spurious Correlations", it shows a very strong correlation between the US per capita consumption of margarine and the Maine divorce rate (r=0.993 from 2000 to 2009). Tyler simply searched his database for this combination. To better understand the difference between correlation and causation, below we give more detailed correlation vs causation examples that demonstrate various ways to distinguish between the two.
Importance of correlation and causation
Whether a choice is informed by correlation vs. causation determines whether you have identified an avenue to explore vs. demonstrated that an intervention is effective. Correlation will always be useful to the researcher, but it does not answer the key policy question - i.e., "If I intervene/modify this factor, will my outcome improve?" Such questions may include:
- Will offering reading tuition improve literacy (or will only better parents enroll their children)?
- Will this intervention reduce patients' blood pressure (or just that sicker people seek it out?)
- Will reducing prices drive more customers to our shop (or were they visiting over the long weekend?)
Clearly there is value in knowing that these correlations exist, but acting on them without confirmation can be very costly. Observational studies indicated that HRT reduced post-menopausal women's chance of cardiac disease by 40-50%. Randomized trials did not show this benefit and suggested potential harms from estrogen + progestin, leading to its premature closure in 2002. There has been much debate about the discrepancy, with healthy user bias as one proposed explanation. Ultimately when understanding the difference between correlation and causation, correlations should be recognized but further interrogated and interventions pursued on the basis of demonstrated causal associations.
Want to test a pattern of your own? These statistical question ideas can help you turn a curious correlation into a focused research question.
What is correlation?
Correlation is a statistical relationship showing that two variables change together, so knowing one helps you predict the other.
- Direction: It can be positive (both rise together), negative (one rises as the other falls), or near zero (no clear pattern).
- Strength: The correlation coefficient, r, runs from −1 to +1. Values near either end are strong, and values near 0 are weak.
- Example: In many classes, students who study more hours tend to earn higher exam scores. The pattern shows a link, not the reason for it.
What is causation?
Causation means a change in one variable produces a change in another. The first is the cause, and the second is the effect.
- What it takes: The cause comes first, the effect follows when it changes, and other explanations are ruled out.
- Example: Smoking causes lung cancer. No single study settled it, but repeated studies, a plausible explanation, and ruled-out alternatives built the case.
Does correlation imply causation?
No. In any correlation vs causation question, the safe answer is that a correlation can reflect a real cause, but it can also come from a hidden third variable, from the effect running in the opposite direction, or from chance. Treat it as a clue. An observational study, so a correlation tells you where to look, not what to conclude.
If a deadline is close, you can also pay for statistics homework help and have our experts handle the calculations and write-up.
Deadline coming up?
From research design to final draft, an expert can help you complete your research paper on time.

What is the difference between correlation and causation?
Correlation describes a pattern: two variables change together. Causation describes a mechanism: changing one variable produces a change in the other.
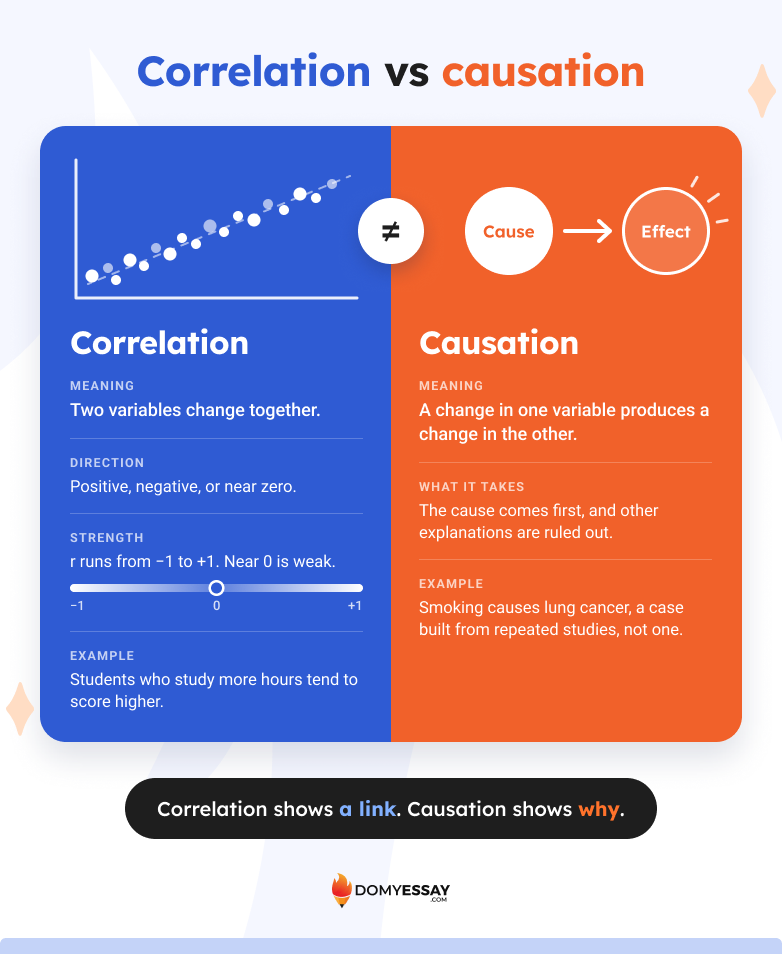
The symmetry row is the one most pages skip. Correlation has no direction, because the coefficient between A and B is the same as between B and A. Causation is asymmetric, which is why direction matters: rain causes wet streets, but wet streets do not cause rain.
Correlation vs causation examples
These examples of correlation vs causation come from medicine, business, economics, and education research. Each shows a different way a pattern in data can mislead, from a hidden third factor to a randomized trial that overturned an observational result.
Confounding variable
1. Sunscreen use and melanoma
The correlation: In many observational studies, people who used sunscreen had no lower, and sometimes higher, melanoma rates.
The wrong conclusion: Sunscreen causes skin cancer.
What’s actually going on: Sun exposure, sunburn history, and skin type confound the link. People who burn easily or spend long hours in the sun use more sunscreen, and some use it to stay out longer. A review of 28 studies found that adjusting for these factors moved estimates toward lower melanoma risk among users, and the one randomized trial showed a protective effect.
Source: Rueegg et al. (2019), International Journal of Cancer
2. Paid search ads and online sales
The correlation: People who click a company’s paid search ads buy at high rates.
The wrong conclusion: Every purchase after a click is a sale the ad created.
What’s actually going on: Clicks and purchase intent are correlated, because many clickers already planned to buy. In field experiments at eBay, returns from paid search were a fraction of conventional estimates, and ads on the brand’s own name had no measurable short-term benefit.
Source: Blake, Nosko & Tadelis (2015), Econometrica
Reverse causation
3. Police numbers and crime
The correlation: Studies comparing cities found little sign that more police meant less crime, and the raw link could even run positive.
The wrong conclusion: Police do not reduce crime.
What’s actually going on: The arrow runs both ways. Cities hire more police when crime rises, so police spending is an increasing function of crime. Using election-year hiring as a natural experiment, Levitt estimated that more police substantially reduce violent crime. Later replications debated the method, so treat the effect size as contested.
Source: Levitt (1997), American Economic Review
4. Body weight and survival in sick patients
The correlation: Among patients with conditions such as heart failure or kidney disease, some studies found that heavier patients had lower mortality.
The wrong conclusion: Extra weight protects against death.
What’s actually going on: Serious illness causes weight loss, so low weight can be a result of the disease that kills, not the cause. In a hospital study, patients who died showed more weight loss than survivors. Reverse causation is the obesityparadox.
Source: Factors involved in the paradox of reverse epidemiology
Coincidence
5. Nicolas Cage films and pool drownings
The correlation: From 1999 to 2009, the number of people who drowned in swimming pools tracked the number of films Nicolas Cage appeared in (r = 0.666).
The wrong conclusion: Cage’s films lead to drownings.
What’s actually going on: Nothing. The chart’s creator told NPR the match rests on a very small set of numbers and is most likely coincidence.
Source: NPR interview with Tyler Vigen
6. US nuclear power and pool drownings
The correlation: Vigen’s charts pair power generated by US nuclear plants with swimming-pool drownings at r = 0.90.
The wrong conclusion: Nuclear plants cause drownings.
What’s actually going on: The same drowning series also matches the Cage data, which is what you expect when thousands of variables are compared. Vigen’s database holds 25,237 variables, which he compared against each other in more than 636 million, a method he calls data dredging.
Selection and sampling bias
7. Moderate drinking and longer life
The correlation: Many cohort studies found a J-shaped curve: light drinkers had lower mortality than abstainers.
The wrong conclusion: A daily drink prolongs life.
What’s actually going on: The abstainer group included former drinkers who quit because of poor health, which makes light drinkers look healthy by comparison. After adjusting for these biases, one meta-analysis found no significant reduction in mortality for low-volume drinkers (RR 0.97, 95% CI 0.88 to 1.07). Some researchers dispute the study selection, so the question is still debated.
Source: Stockwell et al. (2016), Journal of Studies on Alcohol and Drugs
8. Selective colleges and graduates’ earnings
The correlation: Graduates of highly selective colleges earn more.
The wrong conclusion: Attending an elite college raises earnings.
What’s actually going on: Elite colleges admit students with traits linked to high earnings, so the pattern may come from who gets in. Dale and Krueger compared students who were accepted by similar colleges. In their data, those who attended more selective schools earned about the same as comparable students who attended less selective ones.
Source: Dale & Krueger (2002), Quarterly Journal of Economics
Famous research reversals
9. Beta-carotene and lung cancer
The correlation: Observational studies linked fruits and vegetables rich in beta-carotene to lower lung cancer risk.
The wrong conclusion: Beta-carotene supplements prevent lung cancer.
What’s actually going on: The trials said otherwise. The Finnish ATBC trial of male smokers found no reduction, and its authors noted that beta-carotene intake may simply mark a protective lifestyle. Across ATBC and CARET, the National Cancer Institute reports that high-dose beta-carotene increased lung cancer risk in heavier smokers.
Source: ATBC Study Group (1994), NEJM; NCI summary
10. Vitamin D levels and disease
The correlation: Observational studies linked low blood levels of vitamin D to higher risks of cancer and cardiovascular disease.
The wrong conclusion: Vitamin D pills prevent both.
What’s actually going on: The VITAL trial randomized 25,871 adults to 2,000 IU of vitamin D daily or placebo. Over about five years, supplements did not lower the incidence of invasive cancer or major cardiovascular events. Blood levels can reflect general health, sun exposure, and lifestyle, though the trial itself shows only that the supplement did not lower risk.
Source: Manson et al. (2019), NEJM
How do you write about correlation in an academic paper?
Match your verbs to your design. In any correlation vs causation question, use association language for correlational and observational findings, and keep causal verbs for experiments. JAMA’s author instructions say randomized trials, and that other designs should be described in terms of association. The swaps below follow Stanford’s guide.
Report the correlation coefficient, its direction, the sample size, and a confidence interval. Then name likely confounders in your limitations section, and avoid advising action on an association alone. Studies designed to estimate causal effects under stated assumptions can use causal wording, but authors should say so explicitly.
To check whether an observed correlation could be due to chance, follow the 7 steps in hypothesis testing, which walk you from stating the hypotheses to reporting the decision.
What mistakes do students make with correlation and causation?
- Using causal verbs in a correlational study. Writing that screen time “reduces” sleep, from survey data, claims a cause the design cannot show. Use “is associated with,” and keep causal verbs for experiments, as JAMA’s author instructions require.
- Ignoring the direction of the relationship. A correlation has no direction, but an explanation does. When A and B move together, ask whether B could be driving A, as when illness causes weight loss and low weight looks deadly. State which direction you are testing.
- Treating a strong r as evidence of cause. The coefficient shows how tightly points follow a line, not why. Margarine consumption and Maine’s divorce rate reach r = 0.993 with no link between them. Judge the design, not the size of r.
- Failing to name confounders. Readers cannot weigh your claim unless you name plausible third variables, such as age, income, or season, and say whether you controlled for them. Without that step, ice cream sales look like a cause of drowning.
- Concluding causation from a single study. One study rarely settles cause. Smoking and lung cancer was established through a plausible mechanism, repeated studies, and ruled-out alternatives. Cite replications, and state what your study cannot show.
- Assuming no correlation means no relationship. Pearson’s r measures only the degree of linear association. If Y = X² for X from −3 to 3, r is exactly 0 even though X fully determines Y. Plot your data before declaring variables unrelated.
If you plan to test a correlation in a class assignment, browse these stat project ideas for topics with accessible data.
Final words
Correlation means two variables move together, and causation means one produces a change in the other. A strong pattern can come from a hidden third variable, from the effect running backward, or from chance, so a correlation alone never proves a cause. Use experiments or converging evidence to test cause, and write “is associated with” for correlational findings.